A project to predict whether a tobacco retailer in New York City will sell to youth and identify the variables that influence this activity using random forest, decision tree, bayesian networks, gaussian process, DBSCAN, and spatial autocorrelation.
Authors: Nurvirta Monarizqa / Tashay Green / Zhaohong Niu / Sharon Jiaqian Liu. This is a final project for Machine Learning for Cities Course, CUSP New York University, Spring 2017.
Introduction
Roughly 260 million cigarettes were sold in the United States during 2016, contributing to over one trillion dollars in revenue for leading tobacco production companies. Most of the world’s tobacco is processed into cigarettes, however there is a growing market of other tobacco products such as smokeless tobacco, electronic cigarettes, hookahs, and others. The United States is the fourth largest tobacco-producing country in the world, whose citizens make up 16% of smokers across the globe. To reach the ~16% of smokers in the United States, tobacco companies spent over 10 billion dollars on marketing campaigns. Such ads have been known to specifically target women and adolescents; adolescents who find the ads appealing have an increased desire to begin smoking.
Cigarette smoking is common in adolescents ages 12 to 17. Many adult smokers report first trying smoking before the age of 18 as tobacco use is established primarily during adolescence. In New York City, 15,000 public high school students currently smoke cigarettes and will die prematurely as a result of smoking. Along with premature death, youth are at risk of developing lung diseases, cancers, and asthma from smoking.
Cigarette smoking among youth in the United States has declined in recent years but the use of other tobacco products has increased. Rates of electronic cigarette and hookah smoking have seen spikes among youth since 2011.
Because youth are most sensitive to the cost of tobacco products, making them less affordable has been an effective strategy for deterring consumption. Though cost increases are effective, other interventions such as stronger regulations are also necessary. Being able to determine the most vulnerable youth populations and environments, can significantly inform targeted reduction and regulation efforts.
Research Question and Motivation
The aim of this research project is to predict whether a tobacco retailer in New York City will sell to youth and identify the variables that influence this activity. This project has the potential to inform regulation policy and smoking reduction efforts relating to youth in New York City. Reducing smoking among youth in New York City may result in improved health conditions, social interactions, and academic performance.
Determining whether and why a retailer may sell tobacco to youth is a challenging and imperfect science. Our interpretable models will be correlational and cannot pinpoint causality. Without detailed information about the lives of youth purchasing tobacco illegally (e.g., home location, socioeconomic status, guardianship status, school performance, etc.), it is impossible to definitively say how susceptible they may be to purchasing tobacco products. Furthermore, because reports of illegal sales to youth are initiated by citizens and not an enforcement agency, it is uncertain that the transaction actually occurred.
Related Work
Analysis of factors related to illegal tobacco sales to young people in Ontario (O`Grady, Asbridge, Abernathy, 1999)
Research conducted in Ontario, Canada concluded that older adolescents and females were more like to successfully purchase tobacco products, especially in tobacco-producing regions. Results of the study was gathered through random compliance checks of tobacco retailers where youth were intentionally sent to selected retailers to attempt a purchase of cigarettes.
The density of tobacco retailers in home and school environments and relationship with adolescent smoking behaviours in Scotland (Shortt, Tisch, Pearce, Richardson, Mitchell, 2016)
This research project primarily sought to examine how the density of tobacco retailers impacted smoking rates among adolescents in Scotland. The study concluded that higher densities of tobacco retailers in residential neighborhoods, correlated with higher smoking rates in adolescents. A final recommendation was made to reduce density of neighborhood tobacco retailers to curb adolescent smoking.
We will apply prior thinking and research methodologies to the youth smoking endemic in New York City. Like the aforementioned related works, we have included variables for gender, age, retailer density, and retailer proximity to schools. Our research differs because we do not include the presence of tobacco production, use actual youth to solicit tobacco products, nor do we include information about youth younger than high school age. Referenced research does not make mention of using citizen reports of illegal sales during experimentation, which we will use in our iteration of research. Since the Ontario study relies on sparse compliance checks, our report data may be more telling since it can be obtained on a more frequent basis, as individuals are able to file reports any time.
Data
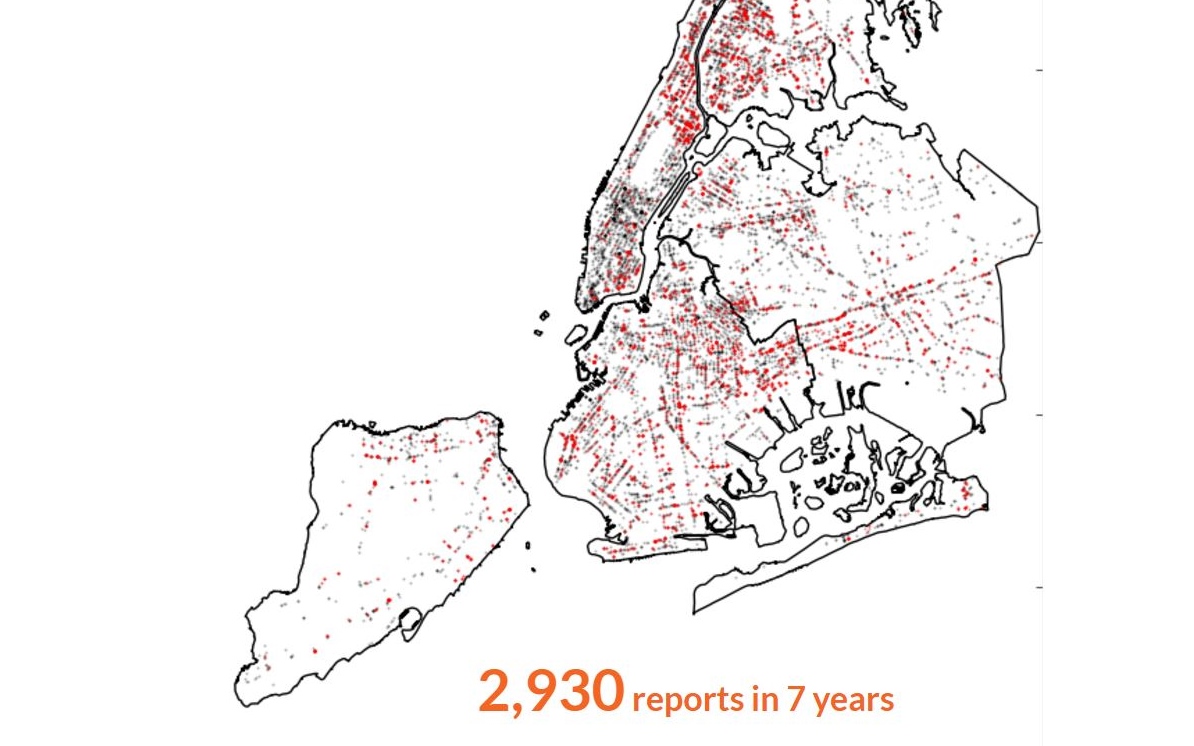
The dataset used in this project is a merged dataset from various resources (see Table 1). First, we got a dataset from New York State Open Data about the locations of all tobacco retailers in New York State. We spatially joined the data to a New York City shapefile to get only the tobacco retailers in New York City. Then, we filtered the 311 data to contain only reports pertaining to cigarette sales to youth. We merged both datasets based on location (nearest neighbor under 200 feet) to get the number of reports for each tobacco retailer.
Other factors that we are interested in are the proximity of the retailer to the subway station, distance to nearest high school, “density” of tobacco retailers and schools in a census tract. For the proximity, we calculated the distances of each tobacco retailer to the nearest subway and high school. For number of tobacco retailers, we spatially joined the census tract shapefile with tobacco retailer data. Lastly, for school density, we calculated the number of schools in a 1 mile radius of a given tobacco retailer.
To take into account socioeconomic and demographic factors, we gathered the total population and median household income of a census tract. We also retrieved academic performance data about high schools nearest tobacco retailers to paint a picture of the youth that may be illegally purchasing tobacco products. Academic data included the percentage of female students for a school, percentage of students for each race, enrollment, percent of poverty, and student achievement rating.
Finally, the master dataset contained 10526 tobacco retailers with 22 valid columns, including id, BoroCT2010, n_report,DBN, school_distance, n_school, subway_distance, n_tobacco, Enrollment, Student Achievement Rating, Percent White, Percent Black, Percent Hispanic, Percent Asian,% Female, % Poverty, MHI, Total Population, type, latitude, longitude and class.
Based on the feature n_report, which indicates the frequency of tobacco sales to youth, the whole dataset is split into classes. We did both binary class separations and multiclass separations of the data. For binary class separation, if the store had sold cigarettes to youth in the past, it was assigned to class 1, otherwise, 0. For multiclass separation, if the store had 0 reports, it was assigned to class 1, 1 to 2 reports it belong to class 2, 3 to 10 reports it belong to class 3 and those contain more than 10 reports are class 4. Class information is stored in the feature class (see Table 2).
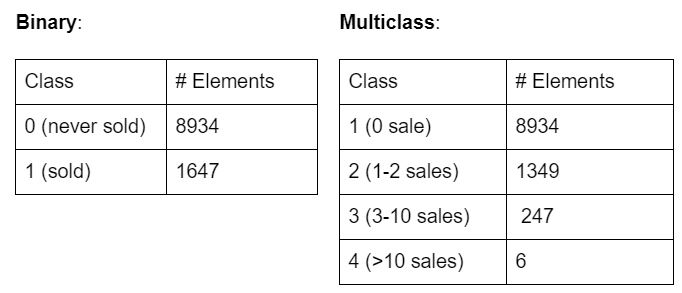
Table 2. class feature has been categorized in a binary and multiclass fashion based on the number of reports per tobacco retailer. Each machine learning method was attempted using binary and multiclass, typically only the binary classification produced fruitful results.
Data Sources:
- Tobacco Retailer NY
- 311 reports
- Subway entrances
- School performance data
- Median household income and population
Methodologies
Decision Tree
One classification method we utilized for this study was the Decision Tree. Using binary values as targets (0: never sold tobacco products to youth and 1: reportedly sold tobacco products to youth) for each tobacco retailer, we attempted to predict whether a retailer would or would not sell to youth.
In the first iteration, we trained a Decision Tree using attributes school_distance, subway_distance, n_tobacco, Enrollment, Percent White, Percent Black, Percent Hispanic, Percent Asian, % Female, % Poverty, MHI, and Total Population. The tree was able to predict targets with 84% accuracy, 57% precision, and 50% recall. Given that the model achieved 84% accuracy but lower values for precision and recall, we can assume that the decision tree actually predicted a fair number of targets incorrectly. To improve precision and recall we trained a second tree based on the important features identified by the initial tree.
A second decision tree was built using the important features n_tobacco, MHI, subway_distance, school_distance, and Total Population. With the refined features, the model was able to predict targets with 84% accuracy, 71% precision, and 50% recall at max depth = 5 (see Figure 1).
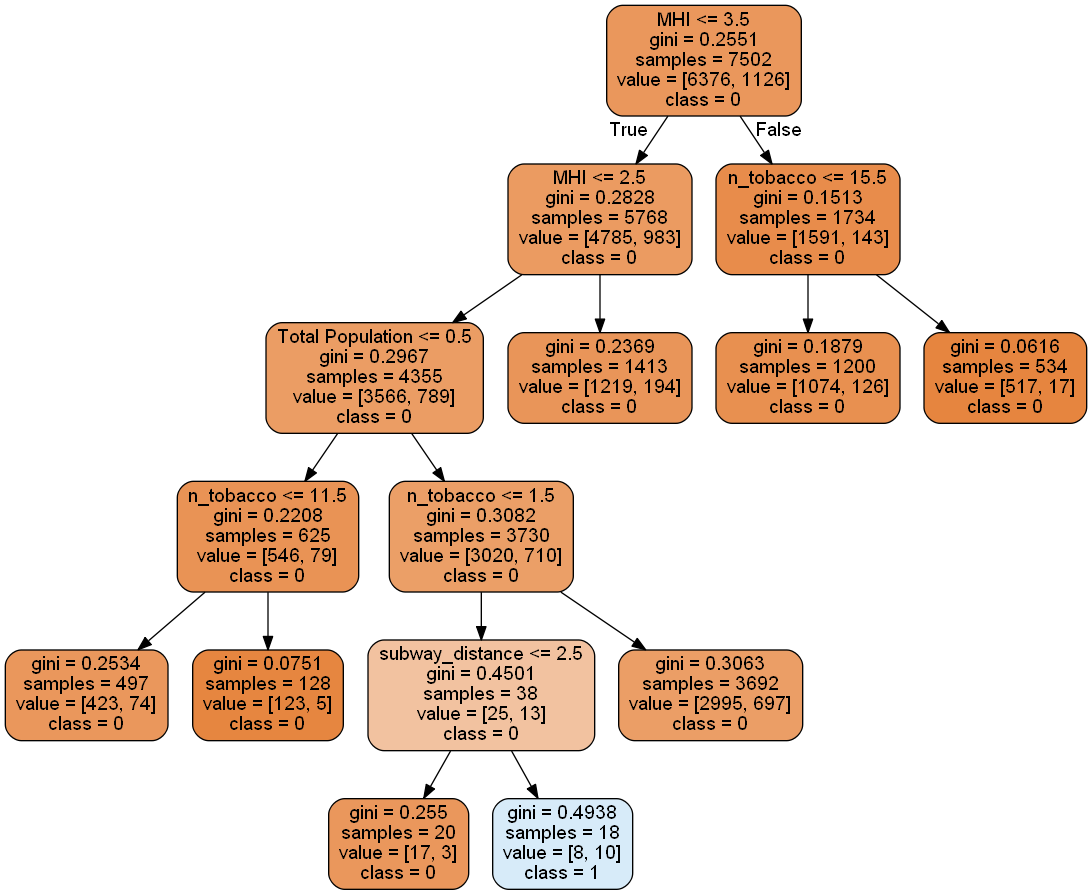
Figure 1. Decision tree based on the five important features of the data set, with max depth 5. The model predicted with 84% accuracy, whether a tobacco retailer would sell to youth, 71% precision and 50% recall. Illegal tobacco sales are of class 0 (no sale) and class 1 (has sold).
Since this model did not take into account spatial attributes, we decided to use other methodologies to identify spatial autocorrelation.
Random Forest
The random forest model is trained on the features school_distance, n_school, subway_distance, n_tobacco, Enrollment, Student Achievement Rating, Percent White, Percent Black, Percent Hispanic, Percent Asian, % Female, % Poverty, MHI, Total Population, type, latitude and longitude are used to fit the model. Student Achievement Rating, are categorized into multiclass and the feature class is the predictable multiclass (4 class) target.
After data preprocessing, the dataset is split into a training set and a testing set with 30/70 proportion. The random forest model successfully predicts 84.67% of the data. The precision is 21.16% and the recall is 25%. The low precision and recall are due to the use of multiclass classification as well as the existence of outliers in class 3 and class 4. The items of these two classes are highly random. The feature importance analysis states that median household income, total population and geographical position are top three factors which significantly impact the probability of tobacco sales to youth (see Table 3).
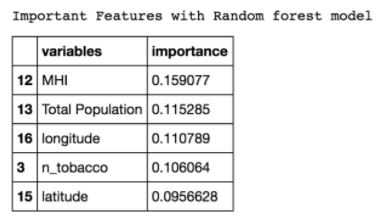
Table 3. Random forest top 5 important features, MHI, Total Population, longitude, n_tobacco, and latitude.
Bayesian Network
We applied a Bayesian Network to classify the tobacco retailers, as well as look for anomalies within the data.The attributes used are school_distance, n_school, subway_distance, n_tobacco, Enrollment, Student Achievement Rating, Percent White, Percent Black, Percent Hispanic, Percent Asian, % Female, % Poverty, MHI, Total Population, type, latitude and longitude. Both binary and multiclass return the same best edges.
From the best edges, we know that some of these features have no relationship to our target class, so we remove them. The remaining features are n_school, n_tobacco, MHI, Total Population, latitude and longitude. Refer to Figure 3 for the network built by training the data.
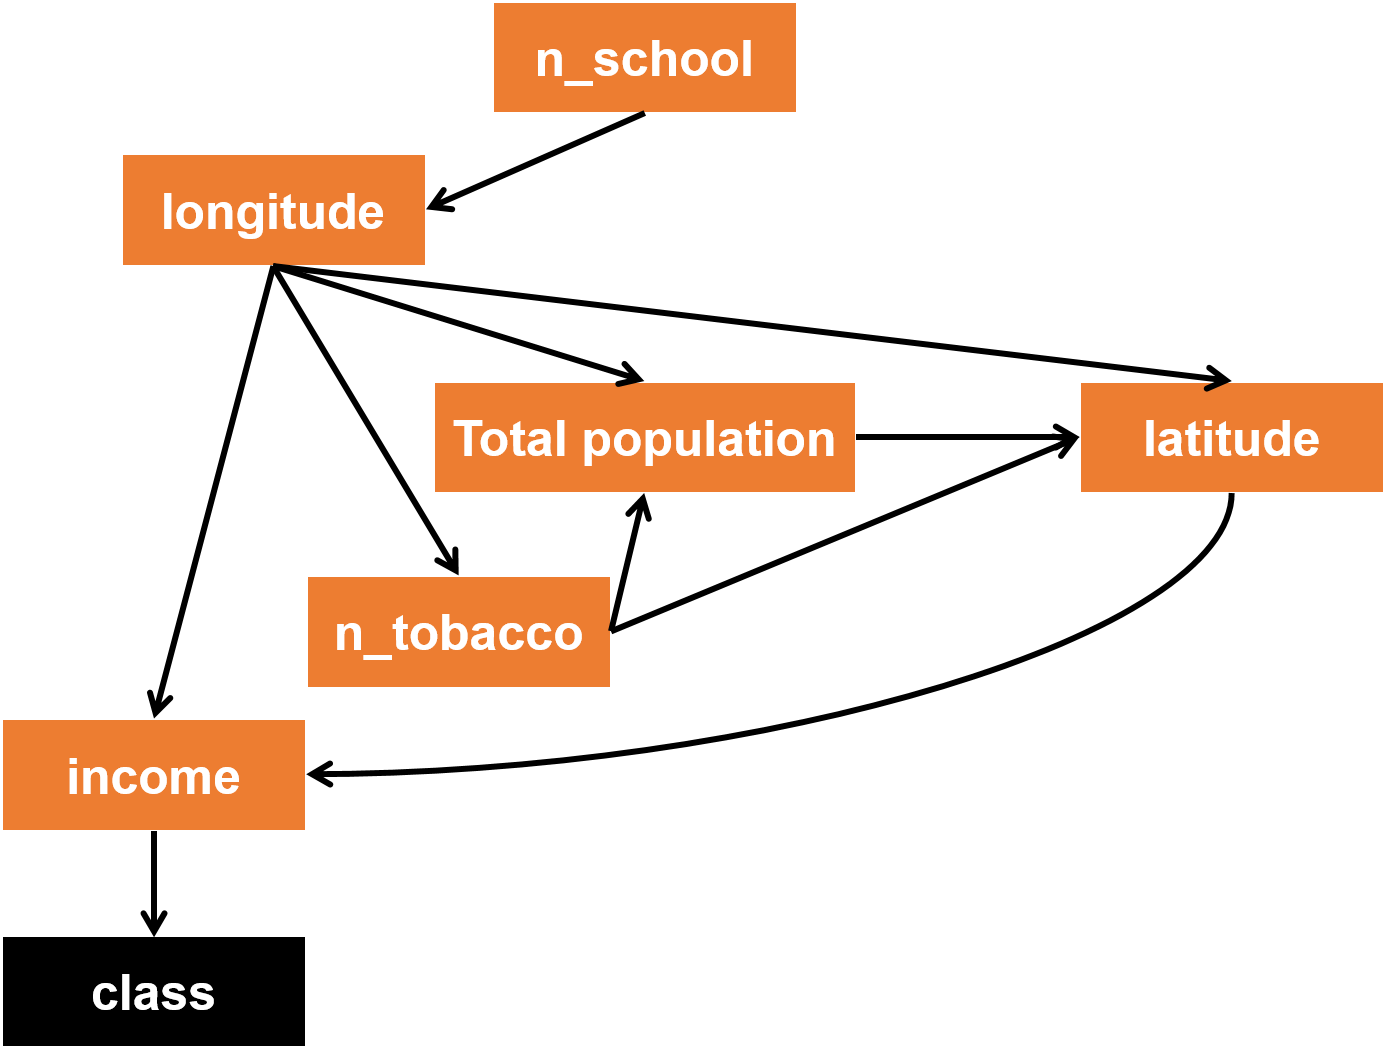
Figure 3. A visualization of the Bayesian network created by the training data.
We tested this model ten times for both binary and multiclass. The model yields an average accuracy, precision, and recall of 84.67%, 42.4%, and 50% respectively for binary. The accuracy is good, however, the percentage of precision and recall are not as good, indicating that this model is good at predicting tobacco retailers that have never sold tobacco to youth, but not otherwise. For the multiclass, the model yields 85% of accuracy because all of the data records are predicted to be class 1. The model, when applied to multiclass, failed to detect classes other than class 1 (have never sold).
For the multiclass categorizations, we tried a different approach to detect the 6 data records belonging to class 4 (have sold > 10). We applied the Bayesian network model above to catch anomalies. However, the top 10 elements with the least likelihood did not contain even 1 member of class 4. The model caught tobacco retailers that have sold tobacco to youth, but had abnormal attributes such as high median household income. Thus, we concluded that this model did not fit our data well.
Overall the model failed to detect multiclass record categorizations (and one of the multiclass as anomaly) most likely because elements in class 3 and 4 have rather random attributes and do not have any plausible pattern based on the attributes that we included in the model. Figure 4 shows that there is no specific spatial pattern for classes 3 and 4, so it is more difficult to detect them.
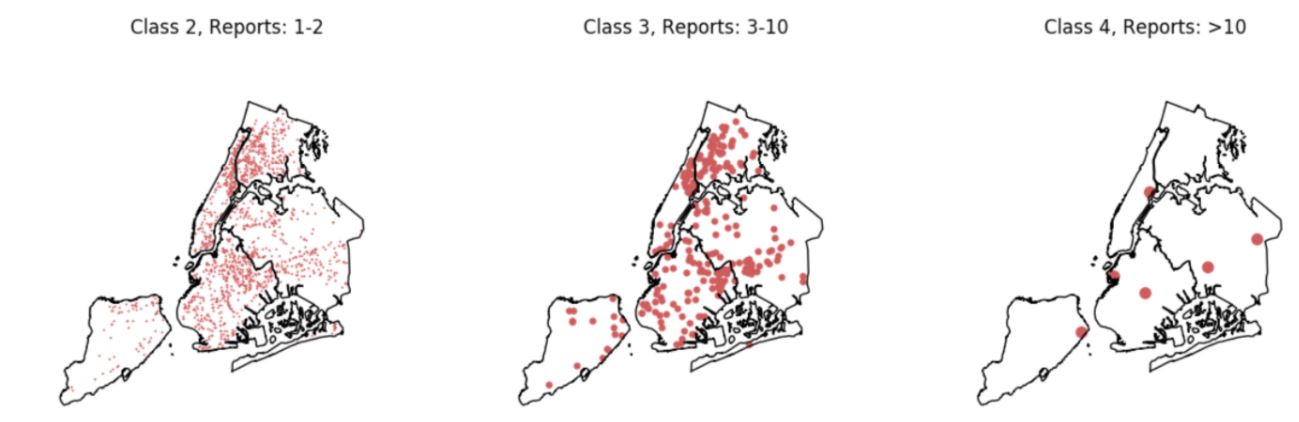
Figure 4. Dispersion of tobacco retailers for multiclass categorizations of the target. Retailers that have 1-2 reports or 3-10 reports are more closely located than those with >10 reports.
DBSCAN
To better understand the spatial distribution of tobacco retailers reported to have sold tobacco products to youth, we conducted DBSCAN and spatial autocorrelation analysis for anomaly detection and clustering.
We chose values where the number of points assigned to clusters were greater than 0 but less than 10% of the data, and scanned a wide range of parameter values. Using features n_report, latitude and longitude, the model detected an unusually dense area of retailers located in upper Manhattan. Figure 4 shows the results with parameters esp = 0.0015 and MinPts = 180 under a loop algorithm for DBSCAN analysis.
To cross-validate the result, we conducted spatial autocorrelation analysis (Moran’s I and hotspot analysis) to identify aggregated areas with a high number of reports. The dataset we used was the summed-up number of reports at the census tract level, with BoroCT Code attached to it. The attributes are transformed, spatial lag of number of reports, number of reports and BoroCT Code merged with census tract shapefile, and was shaped into row-standard with queen weight. The result of Local Moran’s I with Significant LISA (Local Indicator of Spatial Autocorrelation) is 0.167, while hotspot analysis with significant level set to 0.01 indicates that there is one major spatial correlation around East Harlem, Upper Manhattan (see Figure 6). The Moran’s I number is not as high as we expected, indicating that spatial distribution of reports could be rather random. Hotspot analysis supports our DBSCAN results that East Harlem of upper Manhattan has a higher density of reports.
Gaussian Process
The gaussian process was used to predict the number of reports as a function of location. The attributes are the longitude and latitude, with the log of number of reports subtracted by the mean of all the logs, as the target. We used Gaussian Process Regressor with kernel equal to 0.185**2 * RBF(length_scale=0.01) + WhiteKernel(noise_level=0.49). We got the Logarithm of the Marginal Likelihood of -629.318. This number is greater than -1400, thus, the model is interpreted as being a good fit for the data. Much like the DBSCAN, the model is able to identify the cluster of retailers in upper Manhattan that have frequent occurrences of selling tobacco to youth.
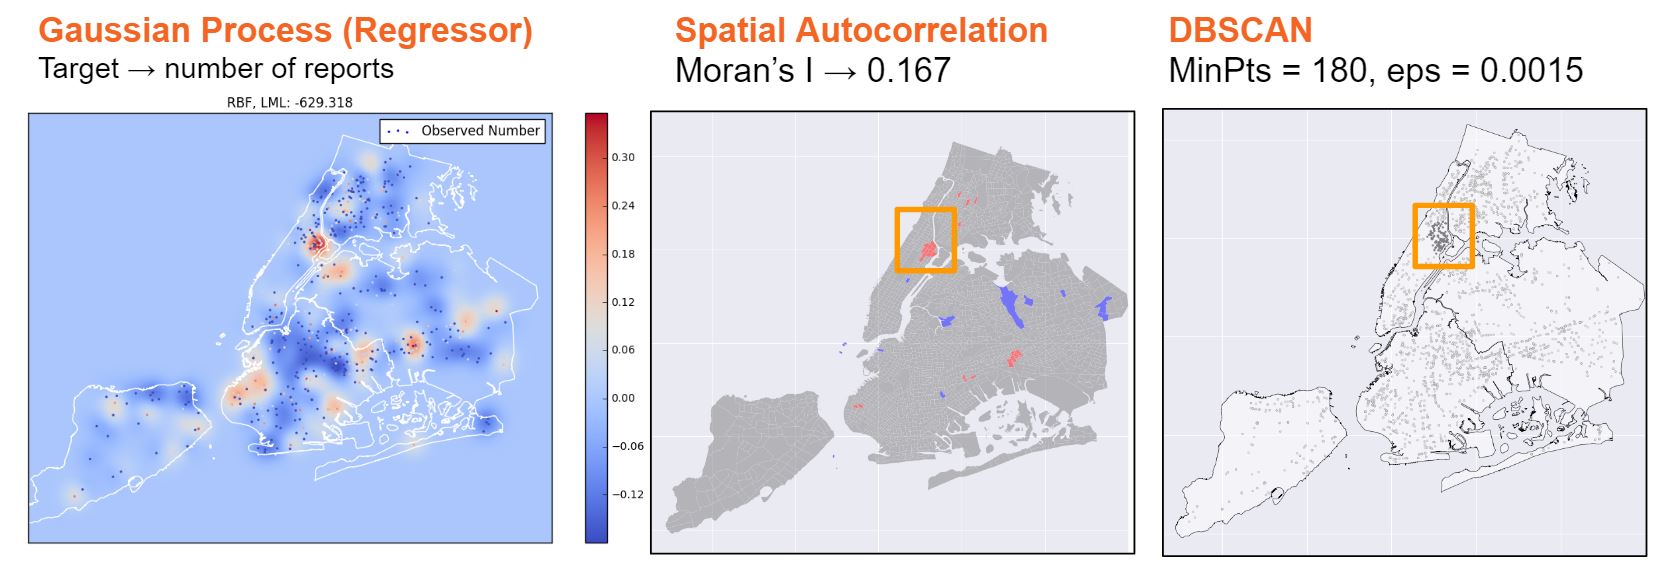
Figure 4. Gaussian process, Spatial Autocorrelation, and DBSCAN show East Harlem, Manhattan as the most prevalent hotspot.
Conclusion
Of the predictive models used in this research, the model that best fit the data and yielded the greatest accuracy and precision values was the Decision Tree. The important features are: median household income, total population, number of tobacco retailers, distance to subway and distance to nearest high schools. According to the top five important features from our trained model (see Table 4), the number of tobacco retailers within a census tract level has a significant impact on whether a retailer would sell cigarettes to youth. The spatial pattern we detected also indicates that East Harlem at Upper Manhattan is where a cluster of tobacco retailers are located that have reportedly sold to youth. Besides location attributes, demographics and socio-economic factors, especially income level of the community also plays an important role, as retailers located within areas of lower median household income are more prone to sell their tobacco products to youth.
| Variables | Importance |
|---|---|
| # of tobacco retailers | 0.168881 |
| Median household income | 0.168077 |
| Distance to subway | 0.125977 |
| Distance to nearest high school | 0.0990679 |
| Total Population | 0.0625302 |
Table 4. Feature importance for the Decision Tree
The results of this study identify important socio-economic and spatial-related factors of tobacco retailers more inclined to sell cigarettes to youth.
Future Work
The 311 tobacco data is generated by residents who reported incidences of illegal sales. However, the propensity to call 311 might be different from one part of the city to another. In this project, we did not include that propensity as it is hard to obtain the exact numbers and the research are still ongoing. Also, it may be interesting to look at timeseries data and apply a model that counts recency and frequency as the attributes, as well as other external attributes such as tobacco survey to youth, tobacco advertisements, etc. to create a model that better predict multiclass targets for tobacco retailers that are likely to sell tobacco to youth.
References
-
Richardson L, Hemsing N, Greaves L, et al. Preventing Smoking in Young People: A Systematic Review of the Impact of Access Interventions. International Journal of Environmental Research and Public Health. 2009;6(4):1485-1514. Retrieved from 10.3390/ijerph6041485
-
Board on Population Health and Public Health Practice; Institute of Medicine; Bonnie RJ, Stratton K, Kwan LY, editors. Public Health Implications of Raising the Minimum Age of Legal Access to Tobacco Products. Committee on the Public Health Implications of Raising the Minimum Age for Purchasing Tobacco Products. 2015 Jul 23. 6, Retrieved from: https://www.ncbi.nlm.nih.gov/books/NBK310405/
-
O’Grady B, Asbridge M, Abernathy T. Analysis of factors related to illegal tobacco sales to young people in Ontario Tobacco Control 1999;8:301-305. Retrieved from: http://tobaccocontrol.bmj.com/content/8/3/301