This project examines the effect of subway delays upon taxi ridership. We combined publicly available data on subway delays and taxi pickups, which were spatially joined using a subway station shapefile. We had assumed that subway delays would yield higher taxi ridership as some subway riders shifted their preference to taxi to arrive at their intended destination. However, our study had mixed results with some stations exhibiting increases in taxi hails and others experiencing decreases.
Authors: Shay Lehmann and Nurvirta Monarizqa. This is a final project for Big Data Management Course, CUSP New York University, Spring 2017
Background
New Yorkers have a vast and varied transportation network at their disposal. To get to any one destination, there are often multiple travel options ranging from walking or cycling to public transportation to hiring private vehicles. We were thus interested in exploring how these services compete with and complement each other. Specifically, we investigated whether subway delays might prompt travelers to switch their mode to taxi. We speculated that people who might usually choose to take the subway would spend extra money on a taxicab in the event of a subway delay. Our null hypothesis can be stated as follows:
\[H_0:\mu_{taxi ridership no delay} \geq \mu_{taxi ridership with delay}\] \[H_1:\mu_{taxi ridership no delay} < \mu_{taxi ridership with delay}\]This was tested on a station-by-station basis. We further speculated that this effect might be strongest for people whose travels were time sensitive. We defined these time-sensitive travels in aggregate as people traveling during the morning and evening rush hours. We therefore also broke the data into time bands and tested the null hypothesis for each band.
Data
Data for taxi ridership and subway delays was collected for June 2016 between the hour of 7am and 8pm.
Taxi Ridership
We used publicly available data on taxi rides published by the Taxi and Limousine Commission for yellow and green taxi cabs. This dataset contains an entry for each ride during the month and has a total size of 1.75GB for yellow and a .24GB for green. We ultimately needed to match taxi ridership with subway delays by station, date and hour. For June 2016, there were thus 198,660 keys to match on given 30 days x 14 hours x 473 stations. Taxi data was pulled from here.
Subway Data
We used subway time data collected by Nathan Johnson. The data is in GTFS format, 6.3 GB in size and contains 125,092 files for June 2016.
Additional datasets
Additionally, we used the subway station shapefile in order to filter taxi rides based on adjacency to a station. Unfortunately, the available subway entrances shapefile does not identify which station an entrance belongs to and it was not clear how to map the entrances to the station. We therefore had to use the station file which represents a station as a single point.
Methodology
Taxi Ridership
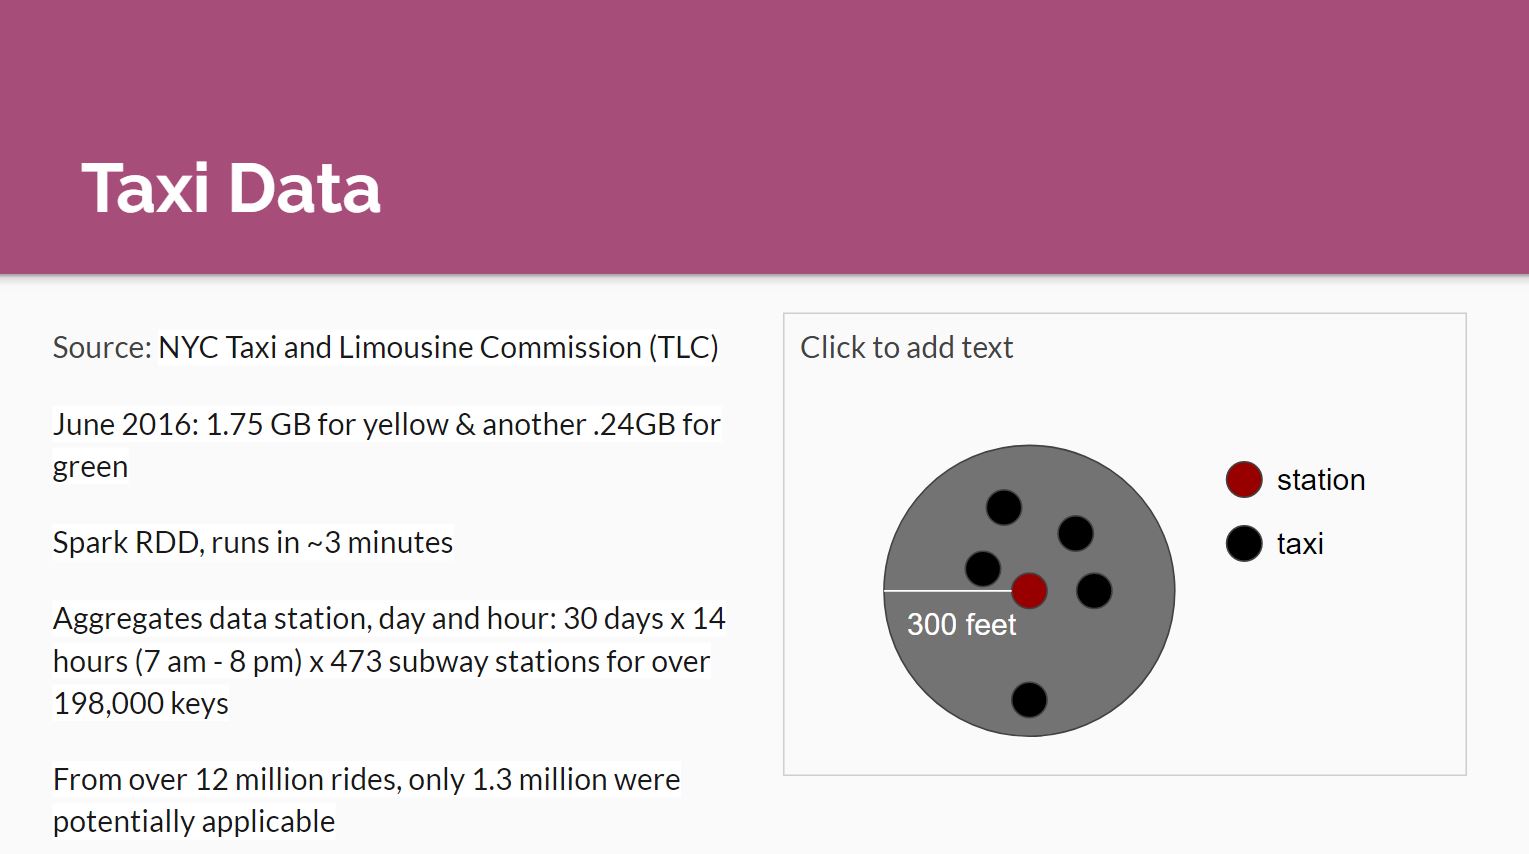
Ridership data was read in as a PySpark RDD and the subway stations shapefile was read in as a GeoPandas geodataframe. We defined our taxi rides of interest as those occurring within 300 feet of a subway station point, noting that the point is not necessarily reflective of a subway entrance. In order to identify the locations, the subway station shapefile was converted from latitude/longitude to northing/easting. We then created a new geometry column representing a 300 foot buffer around the subway station point. The original RDD was mapped to a new RDD limited to a tuple containing date and hour and the station for only those rides with pickups adjacent to a station. Rides also needed to be converted from latitude/longitude to northing/easting using a PyProj projection. We then filtered the dataset to include only the hours of interest (7am - 8pm).
However, this did not yet create an aggregate ride count for each date and hour as each pickup was still identified separately. In order to count rides by station and time, we mapped the station into a list. Station was identified by an integer value so it was converted into a string. This mapping enabled us to Reduce By Key where each date-hour tuple was considered a key and the stations values were turned into a list through addition.
Lastly, we mapped the the value of station lists to a Counter of each station with the number of rides for each date-hour tuple key. The RDD was then collected and converted to csv for further analysis and easier visualization using GeoPandas, Pylab and sklearn. This code runs in approximately 3 minutes and reduces nearly 12 million rides into 1.3 million rides contained within 69,710 lines. This is significantly fewer than the expected 198,660 lines because many stations, particularly in the outer boroughs have no taxi pickups for a given time. We had initially intended on analyzing New York City as a whole, but the low density of taxi rides in many areas of the city practically constrained us to Manhattan. Ride density can be seen in Figure 1 below. Many stations had between 5 and 20 rides in a given time period with a mean of 20 and a median of 11.
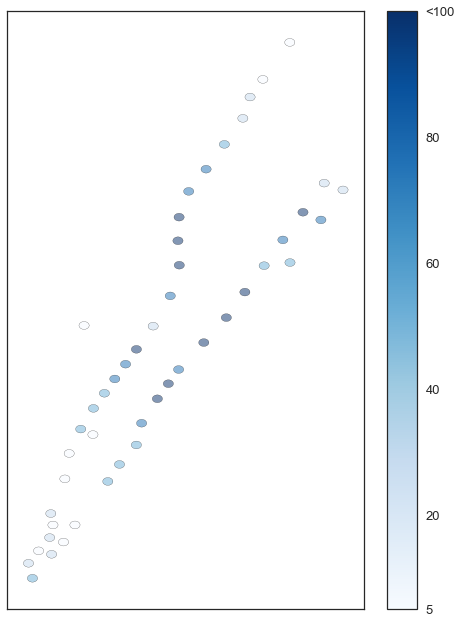
Figure 1: Map of the 1-2-3 and 4-5-6 subway lines with stations colored by mean density of traffic pickups in the area. Stations with fewer than 5 rides are excluded from the map.
Subway Delays
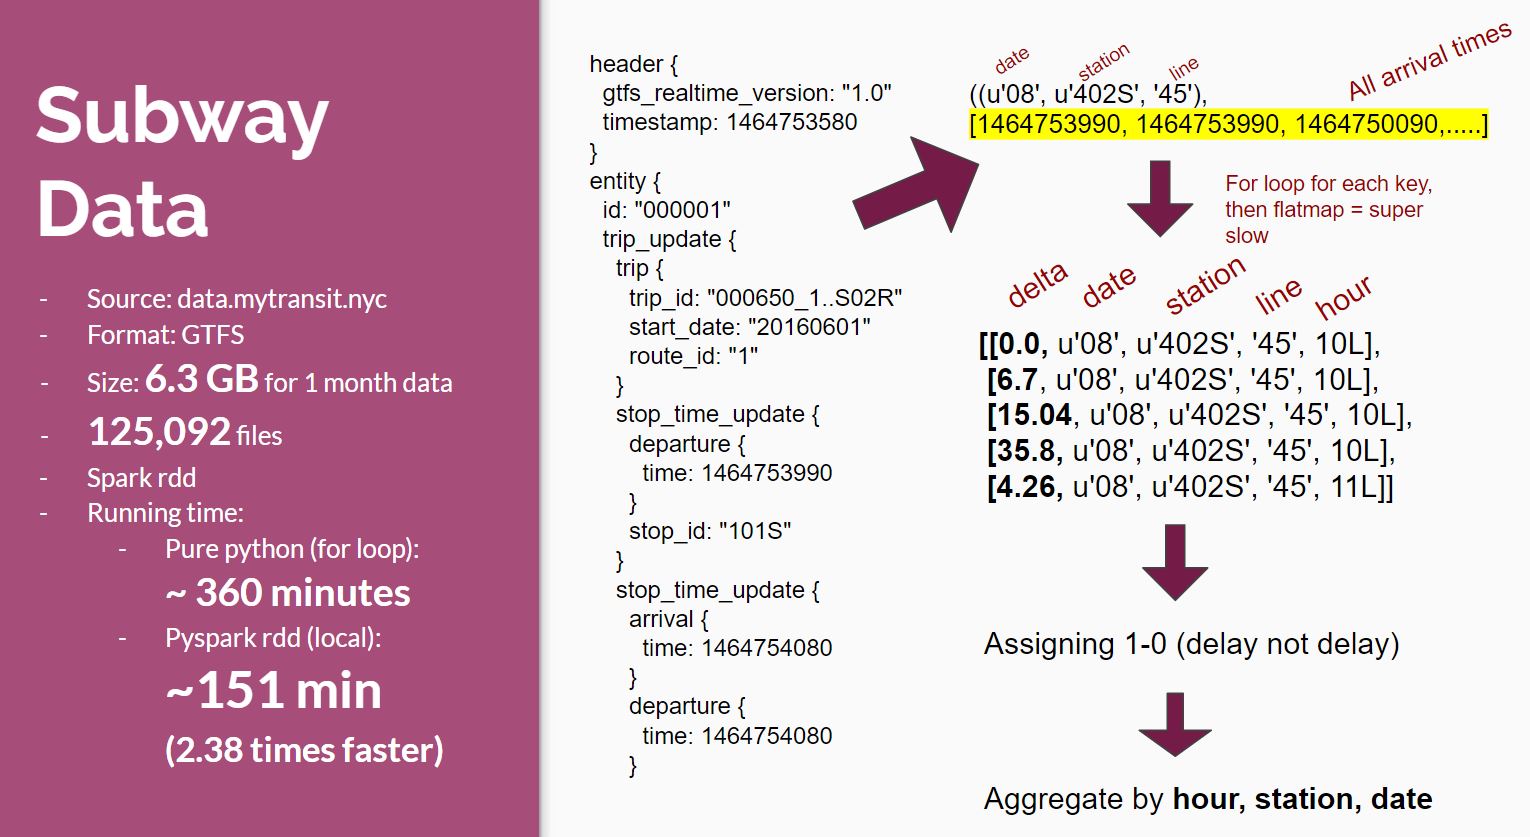
We read the data as a PySpark RDD and performed necessary steps to obtain the delay status: [1] we first filtered out all hours that we were not interested in by the filename; [2] we aggregated the subway arrival time by date, station, and line into a list using ReduceByKey. In this step, we also merged 2 and 3 lines as well as 4 and 5 lines due to the similarity of routes in Manhattan; [3] for each key (date, station, line), we calculated the time delta between previous arrival time and current arrival time, and get the arrival hour (mapValues); [4] calculated delay threshold for each line (groupByKey, mapValues); [5] assigned “1” to every record considered as delay (mapValues); [6] aggregated by hour, station, and date.
Initially, for step [5], we wanted to use subway status data to obtain the delay status for each line, each hour. However, the time delta distributions for each line on delays are very similar to the time delta distributions without delays. Thus, we decided to use 95 percentile as the delay threshold. From step [1], we were able to narrowed down the number of files from 125,092 to 48,608. To make the process effective, we first prototyped the code to 440 sample files and benchmark the running times for twenty-incremental number of files. The three different methods we tried were python with for loop, pyspark with for loop on step [3], and PySpark with numpy array processing on step [3]. Turned out, combination of PySpark and numpy array on step [3] was the best method. The code with python and for loop ran for approximately 360 minutes, PySpark + for loop finished the task in approximately 151 minutes, and combination of PySpark and numpy required only 121 minutes. All code in this step was tested on local pyspark environment (emulated hadoop, PySpark 2GB, running on Microsoft Surface Pro 3)
Data Merge and Tests
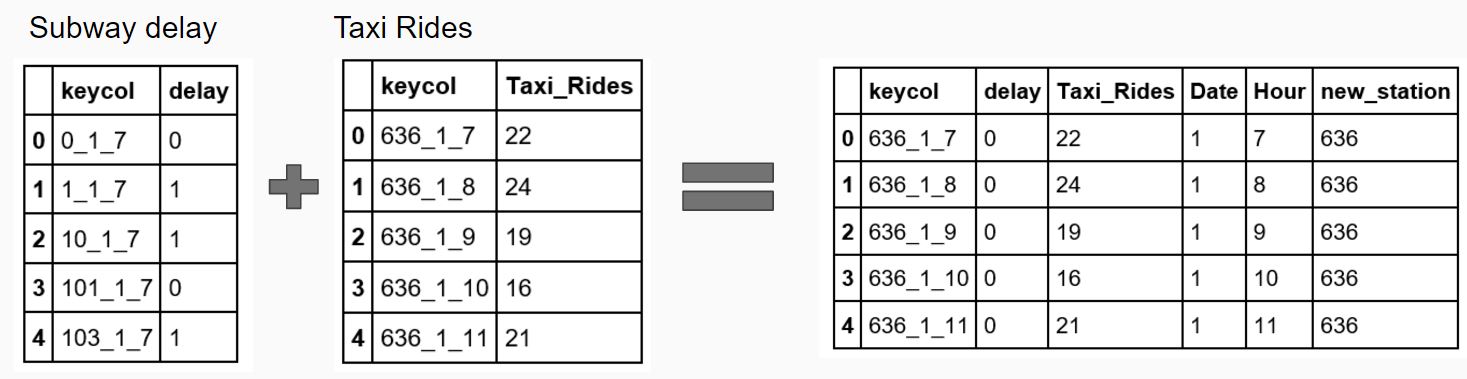
We created a unique key column consisting of station-date-hour and joined the two datasets in Pandas. Stations with fewer than 5 rides on average were dropped from the dataset. Once we had limited the stations to include only those with realtime GTFS data available and greater than 5 rides in an average hour, we were left with 48 stations of interest. T-Tests were then run on a station-by-station basis in order to compare the distributions of taxi riders during delay and non-delay times. We also broke the dataset into three time bands, morning (7-10), evening (4-7) and off-hours (times in between) in case the population was sensitive depending on time and delays were unevenly distributed. T-Tests were then run on these subsets as well on a station-by-station basis.
Results
Time between arrivals distributions
As we can see in figure 3, time between arrivals varies depend on the line. The 95 percentiles for line 1, 23, 45, 6, and L are 17.77, 21.55, 21.07, 18.72, and 11.72 respectively.
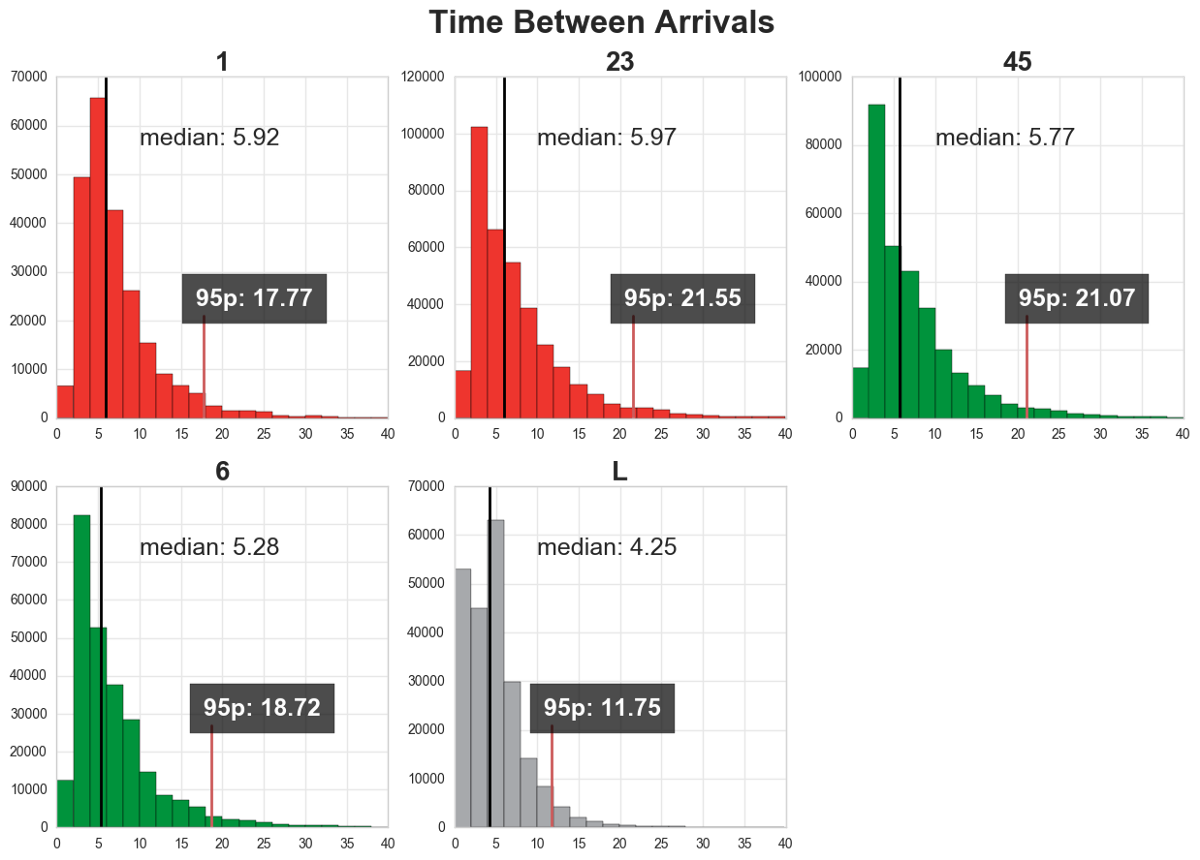
Figure 3. Time between arrivals for each line
T-tests
We performed one-sample T-test on the mean of both taxi rides with delay and taxi rides without delay. Mean of taxi rides on good services is 22.61 while on delays, it is slightly higher on 23.37. With confidence interval of 95% (α=0.05), it returned t=2.62752 and p=0.00860418. Because p < 0.05, we reject the null hypothesis, thus, we can conclude that the mean number of taxi pickups near subway stations with delay is significantly higher than without delay.
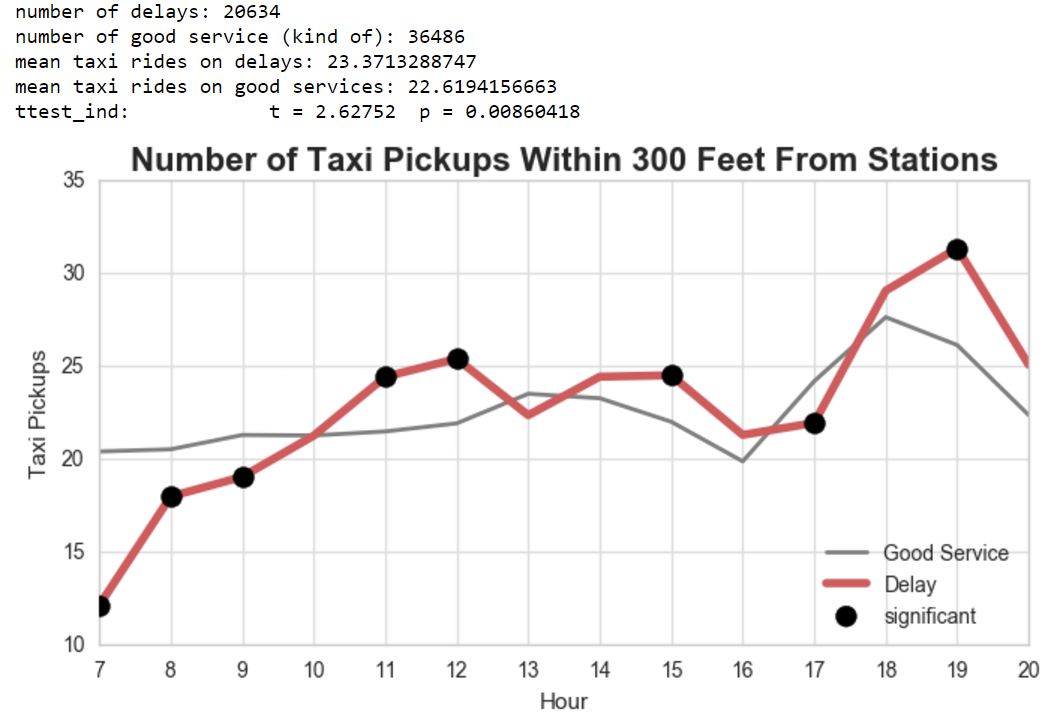
Figure 4. Time sensitivity plot
We also dig further on the temporal and spatial pattern. From Figure 4, we found that some hours are sensitive to the delay (black dots). Interestingly, during morning rush hours (7-9 am) and 5pm, the number of taxi pickups with delay are significantly lower than without delay. This is probably because people are tend to avoid the traffic jam on the street during the rush hours and prefer to take the subway even though there is a delay. At 11 am, 12 pm, 3 pm, and 7 pm, the number of taxi pickups with subway delay are significantly higher than without delay. Those are the hours where people are usually going out for leisure (lunch, socialize), so perhaps the urge to go back quickly to office, or to meet with other people / clients, drives New Yorkers to use taxi more in there hours when there is a subway delay.
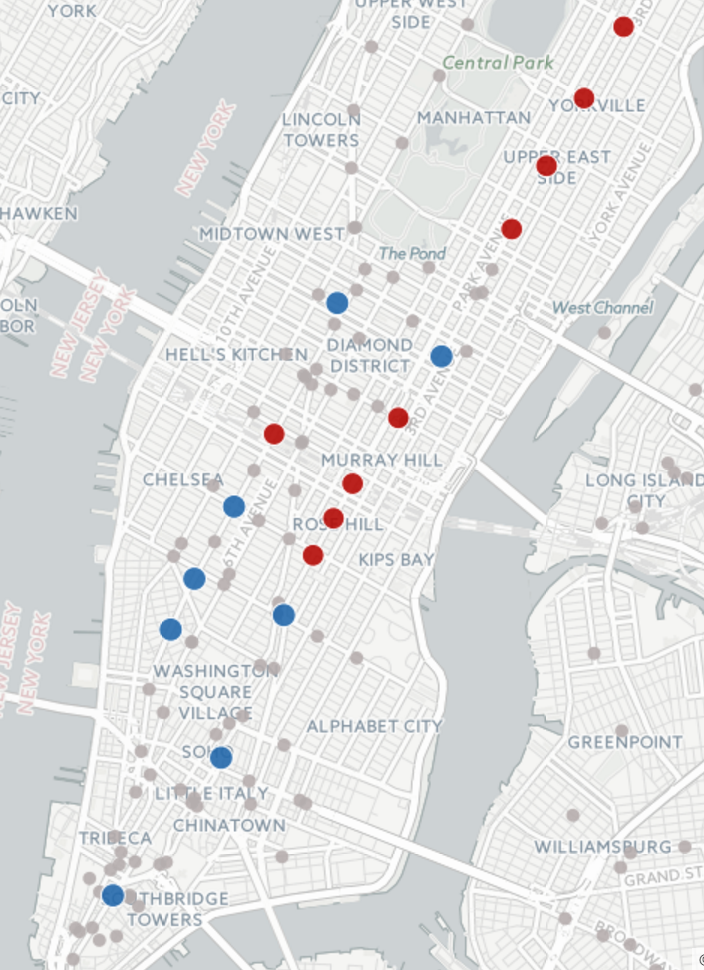
Figure 5. Spatial sensitivity plot
As for spatial pattern, there are 17 stations that are sensitive to subway delay in terms of taxi pickups. Stations that have more taxi pickups with delay are marked with blue dots and the opposite ones are marked with red dots. The blue stations are mainly located below 23 st such as 14st, Spring St, Fulton St and Wall St. Interestingly, all of the red ones except Penn Station, are stations with the 6 line, including Grand Central.
Lastly, taxi rides were grouped into time bands and T-Tests were run for each time band and station in order to further investigate sensitivity to delays over time. Rides were grouped into morning (7-11am), evening (5-8pm) and off-peak (11-5) and T-Tests were run for each station. Since the earlier results had suggested that taxi pickups might decline during delay hours in some instances we also tested an additional null hypothesis with a p-value $\alpha = 0.05$.
Overall, it seemed that rush hour times were associated with lower taxi ridership during delay periods as opposed to off-peak periods as summarized in Table 1.
| Morn | Eve | Off | |
|---|---|---|---|
| # Stations w/ statistically significant increase during delay | 2 | 6 | 29 |
| # Stations w/ statistically significant decrease during delay | 21 | 12 | 7 |
Table 1: Number of stations that were found to have significantly different taxi ridership during delay v. nondelay periods.
Only the Brooklyn-Bridge City Hall station was found to have higher ridership during delay periods across all time slots. 6 stations were found to have significantly lower ridership during delay periods across all time slices. These stations are: 23rd St, 28th St, 33rd St, 68th St-Hunter College, 77th St and 86th St all on the 4-5-6.
Lastly, we took Penn Station as a case study since this station had the most surrounding taxi pickups by far, averaging over 200 pickups per hour as compared to the next highest of 75. Penn Station exhibiting a statistically significant increase in pickups during delays for evenings and off-hours, but a statistically significant decrease in pickups during delays for mornings.
Conclusions
We note several limitations to our study. Namely, we needed to assume that riders choosing to hail a cab in response to subway delays were within a certain proximity to the subway station when they made this decision. This was done in an attempt to capture riders who may have arrived at a station and learned of delay there before changing mode. However, delay information is easily available online so many customers may make that decision before leaving their house, particularly in time sensitive situations. Secondly, we did not control for the availability of alternative subway routes or other means of transportation near the station as it was outside the scope of this project.
Overall, it seems that certain stations are sensitive to subway delays while others are not. Despite our expectation that sensitivity would lead to more pickups, we often found that the opposite was true. Our hypothesis was founded on the idea that commuters may have a greater interest in getting places on time than people traveling for leisure. However, this study seems to suggest that they may be more willing to spend extra money on a taxi cab when their personal plans are at stake. It is also possible that many people use taxis as the second phase of their commute and in times of delays, there are fewer trains arriving and thus fewer people available to take cabs.