Busstat.nyc is a dashboard that communicates overall reliability of New York City MTA buses to the public, on a line-by-line basis.
This project is a capstone project of the CUSP NYU master program sponsored by TransitCenter.
Authors: Ian Wright, Nurvirta Monarizqa, Shay Lehmann, Hongting Chen, Francis Ko.
Data Processing
In order to calculate our chosen metrics, we compare scheduled data with actual data. These two sources are joined on the basis of trip id and an index of our own making which concatenates route, direction and stop number. This index will be referred to as the rds index. For the schedule data, each trip has a given scheduled arrival time at all stops along the route. For the actual data, we assign each bus ping to the next stop. Since the timestamps in the original calls data are broadcast roughly every 30 seconds, they do not necessarily correspond to actual bus stops. We therefore interpolate the actual arrival time by figuring out the relative velocity between available surrounding pings and use that to calculate the arrival time under the assumption that the bus is traveling at a constant speed. If a single bus registers multiple pings with the same next stop id, we use the ping closest to the stop itself and remove any other stops from the dataset.
For this beta phase, we only include data from December 2016 to May 2017.
The Metrics
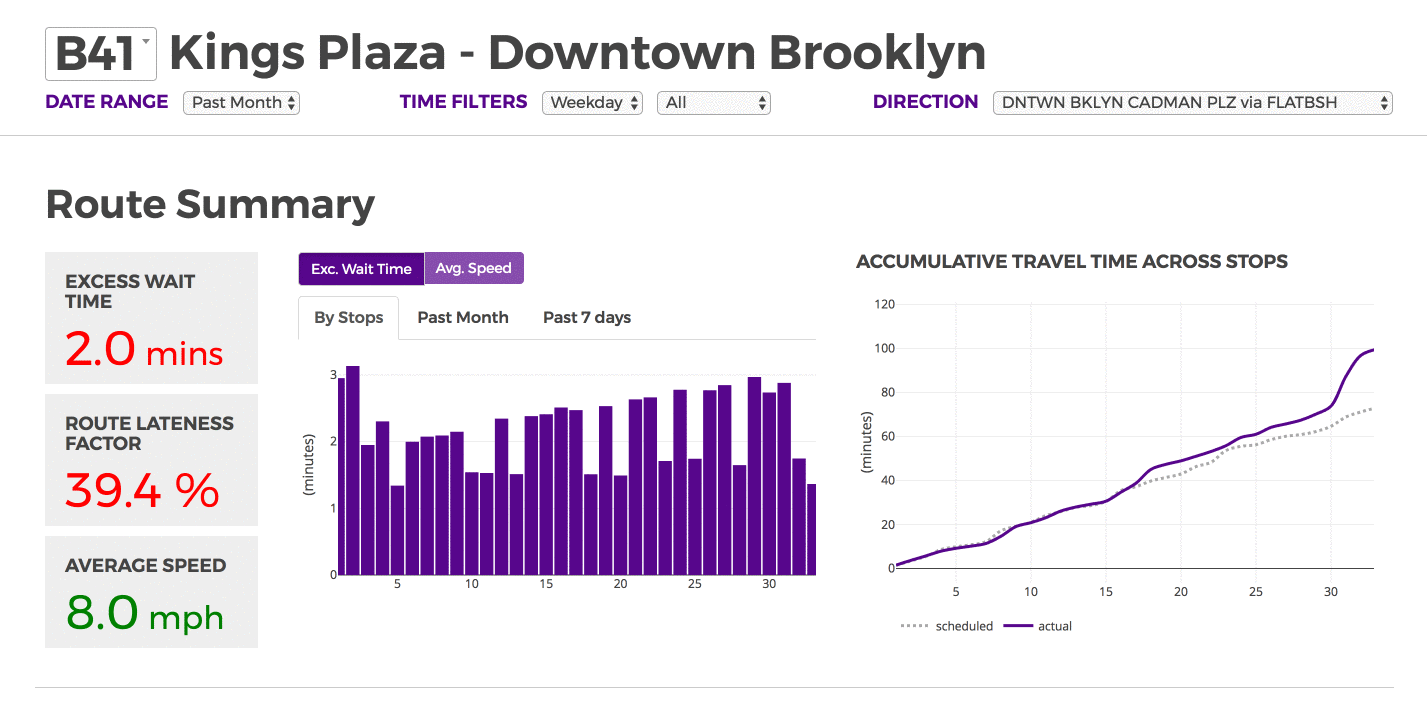
Excess Wait Time
 Our first criterion for evaluation is wait time. We focused on high frequency bus routes, where riders are assumed to arrive randomly at a bus stop rather than consulting a schedule. High frequency in this case is defined as at least one bus every 15 minutes. Since riders are assumed to arrive randomly, we are therefore more interested in the relative time between buses than whether a bus adhered to its schedule. Ultimately, a little less than 75% of routes can be considered high frequency and we are able to calculate wait times this subset.
Route Lateness Factor
 Route lateness factor is how much the trip deviates from the schedule. For example, if the trip is supposed to be completed in 100 minutes but the actual trip time is 120 minutes, then the route lateness factor will be 20%. Higher values indicate greater deviation from the schedule.Route lateness factor is how much the trip deviates from the schedule. For example, if the trip is supposed to be completed in 100 minutes but the actual trip time is 120 minutes, then the route lateness factor will be 20%. Higher values indicate greater deviation from the schedule.
Trip Time
 We calculate the time difference between consecutive stops for the same trip id, both as scheduled and as observed. On the route level, we display percent deviation from schedule based on the calculations defined above. This is based upon the entire end to end route. On the journey level below the route level, we calculate:
- the mean of scheduled travel times
- the mean of actual travel times
- the 95th percentile of the actual time
For the 95th percentile of travel time, we assume that 20% of segments experience the 95th percentile of travel time while 80% experience the mean travel time. This could be an alternative for the public to plan their trip more realistically.

Speed
We join the data with stop distance data in order to evaluate the average speed in miles per hour over any segment, route or journey. This is reported in the same manner for all levels of granularity. Borough level statistics are the weighted average of all routes We filter out any results greater than 40 miles an hour, which is typically either an error or found on Express buses.
Route Selection
We further limit the data to the 200 route with the most available data points. This is both affected by the relative number of buses run, i.e. a route that runs every 10 minutes will show up more often in the data than a route that runs a bus every 15 minutes, and missing data points. Since data is not necessarily collected at a bus stop, there are sometimes buses with too few observations to calculate estimated arrival time.
Limitations
It should be noted that adapting raw GTFS data for is suboptimal, given the fact that arrival times must be interpolated and GPS data is notoriously error-prone in cavernous cities like New York City. Transport For London, which uses Excess Wait Time as a metric to award contracts for bus operators and determine how the contracts pay out, found that they needed to use additional inputs in coordination with GPS data including a Turn Rate Sensor, odometer, definitions of the route, a map and deadreckoning to confirm the true position of the vehicle. The MTA would likely be able to improve upon data collection in the same manner. Thus, we think this estimate is conservative.